candle Volume
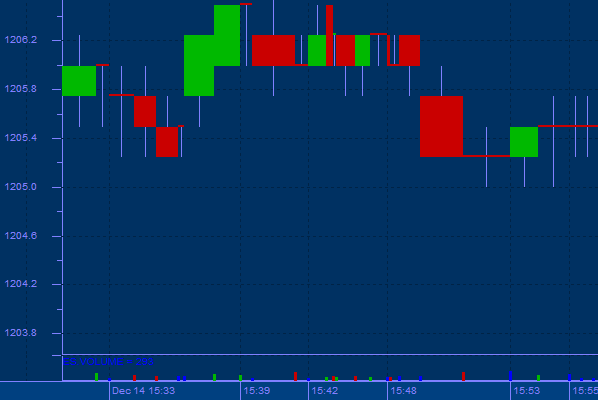
Candlevolume charts are a unique hybrid of Equivolume and candlestick charts. Candlevolume charts possess the shadows and body characteristics of candlestick charts, plus the volume width attribute of Equivolume charts.
The combination gives the unique ability to study candlestick patterns in combination with their volume related movements. The shape of each Equivolume box provides a picture of the supply and demand for the security during a specific trading period. Short and wide boxes (heavy volume accompanied with small changes in price) tend to occur at turning points, while tall and narrow boxes (light volume accompanied with large changes in price) are more likely to occur in established trends.
Candlevolume charts are like candlestick charts in that they indicate the open/close/high/low and a quick reference of market trend. In addition the candlesticks widen or are thinned as a measure of the volume recorded for that particular period. Candlevolume charts represent price and volume data in each candlestick.
They are constructed just like regular candlestick charts with upper and lower “shadows” as well as filled and hollow “real bodies”. Their distinctive characteristic is the width of each candlestick, which varies based on the volume for that particular time period. The higher the volume, the wider the real body of the candlestick.
A “Candlevolume” chart is very much like a regular candlestick chart. Where it differs is as volume increases or decreases, the body of the candlestick widens or narrows. In just a glance, the trader can gain confidence as to the validity of the chart pattern.
Usage:
Candlevolume chart is a great tool for charting. They can be used with charts of all periods. They are especially valuable for intra day charts and will flag a jump in volume that often occurs at the onset of an intra day move. The shape of each Equivolume box provides a picture of the supply and demand for the security during a specific trading period. This type of chart gives the observer a clear picture of whether an increase of volume is contributing to the movement of a stock, future or index. This combination gives you the unique ability to study Candlestick patterns in combination with their volume. Candlevolume charts particularly useful when searching amongst market likely to break out of a sideways movement.

