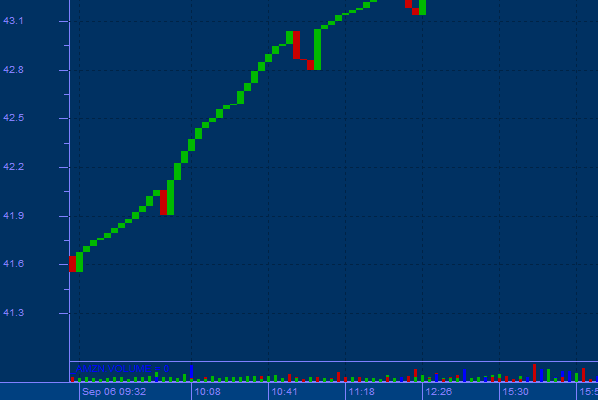
Three line break
Three Line Break charts display a series of vertical boxes (“lines”) that are based on changes in prices. It ignores the passage of time. The Three Line Break charting method is so-named because of the number of lines typically used.
The three line break chart is similar in concept to point and figure charts. The decision criteria for determining “reversals” are somewhat different. The three-line break chart looks like a series of rising and falling lines of varying heights. Each new line, like the X’s and O’s of a point and figure chart, occupies a new column. Using closing prices (or highs and lows), a new rising line is drawn if the previous high is exceeded. A new falling line is drawn if the price hits a new low.
The term “three line break” comes from the criterion that the price has to break the high or low of the previous three lines in order to reverse and create a line of the opposite color. The Three Line Break Charts are actually Any Line Break Charts. They are not limited to just a three line reversal. You can create Two Line Break Charts, or even Eighteen Line Break Charts, if you wish
The following are the basic trading rules for a three-line break chart:
-
Buy when a green line emerges after three adjacent black lines (a green turnaround line).
-
Sell when a red line appears after three adjacent white lines (a red turnaround line).
-
Avoid trading in trend less markets where the lines alternate between red and green
Line Break charts are always based on closing prices. The general rules for calculating a Line Break chart are:
-
If the price exceeds the previous line’s high price, a new white line is drawn.
-
If the price falls below the previous line’s low price, a new black line is drawn.
-
If the price does not rise above nor fall below the previous line, nothing is drawn.
-
In a Three Line Break chart, if rallies are strong enough to display three consecutive lines of the same color, then prices must reverse by the extreme price of the last three lines in order to create a new line:
-
If a rally is powerful enough to form three consecutive white lines, then prices must fall below the lowest point of the last three white lines before a new black line is drawn.
-
If a sell-off is powerful enough to form three consecutive black lines, then prices must rise above the highest point of the last three black lines before a new white line is drawn
Use
An advantage of Three Line Break charts is that there is no arbitrary fixed reversal amount. It is the price action, which gives the indication of a reversal. It is use to determine the prevailing trend.
The disadvantage of Three Line Break charts is that the signals are generated after the new trend is well under way. However, many traders are willing to accept the late signals in exchange for calling major trends.
You can adjust the sensitivity of the reversal criteria by changing the number of lines in the break. For example, short-term traders might use two-line breaks to get more reversals while a longer-term trader might use four-line or even 10-line breaks to reduce the number of reversals. The Three Line Break is the most popular in Japan.
Three Line Break chart focus on price, eliminate much of market noise & identify trend more clearly.Combined with candle signals, they can be the basis of an effective trading strategy

