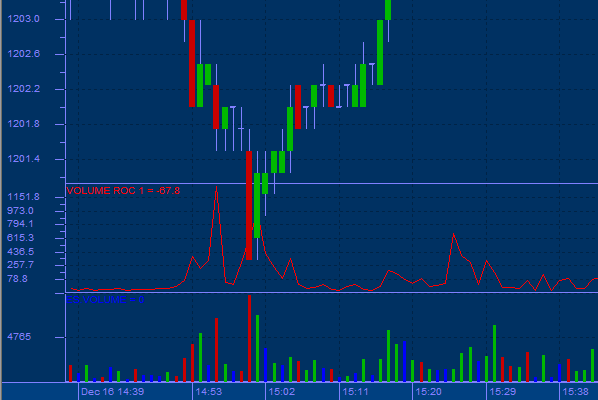
Volume ROC
V-ROC is the indicator that shows whether or not a volume trend is developing in either an up or down direction. The Volume ROC shows the speed at which volume is changing. This can be quite informative as almost every significant chart formation (tops, bottoms, breakouts, etc.) is accompanied by a sharp increase in volume.
The V-ROC shows the rate of change measured by volume. You will need to divide the volume change over the last n-periods by the volume n-periods ago. The answer will be a percentage change of the volume over the last n-periods. Usage:
With most markets, the volume can be expected to within a constant range over time. When volume moves outside this range and begins to trend either upwards or downwards, then a capitulation of one sort or another can be expected. Using this breakout from the average, the VROC is best used as a confirmation indicator to other studies.
If the volume for the current period is higher than n-period ago, the rate of change will be a plus number. If volume is lower, the ROC will be minus number. This allows looking at the speed at which the volume is changing.

